Dashboards, Metrics and Logs
4 September 2022 · Filed in DevOps InfrastructureYour application is doing something unusual, or perhaps it is not even starting up

What is a Dashboard?
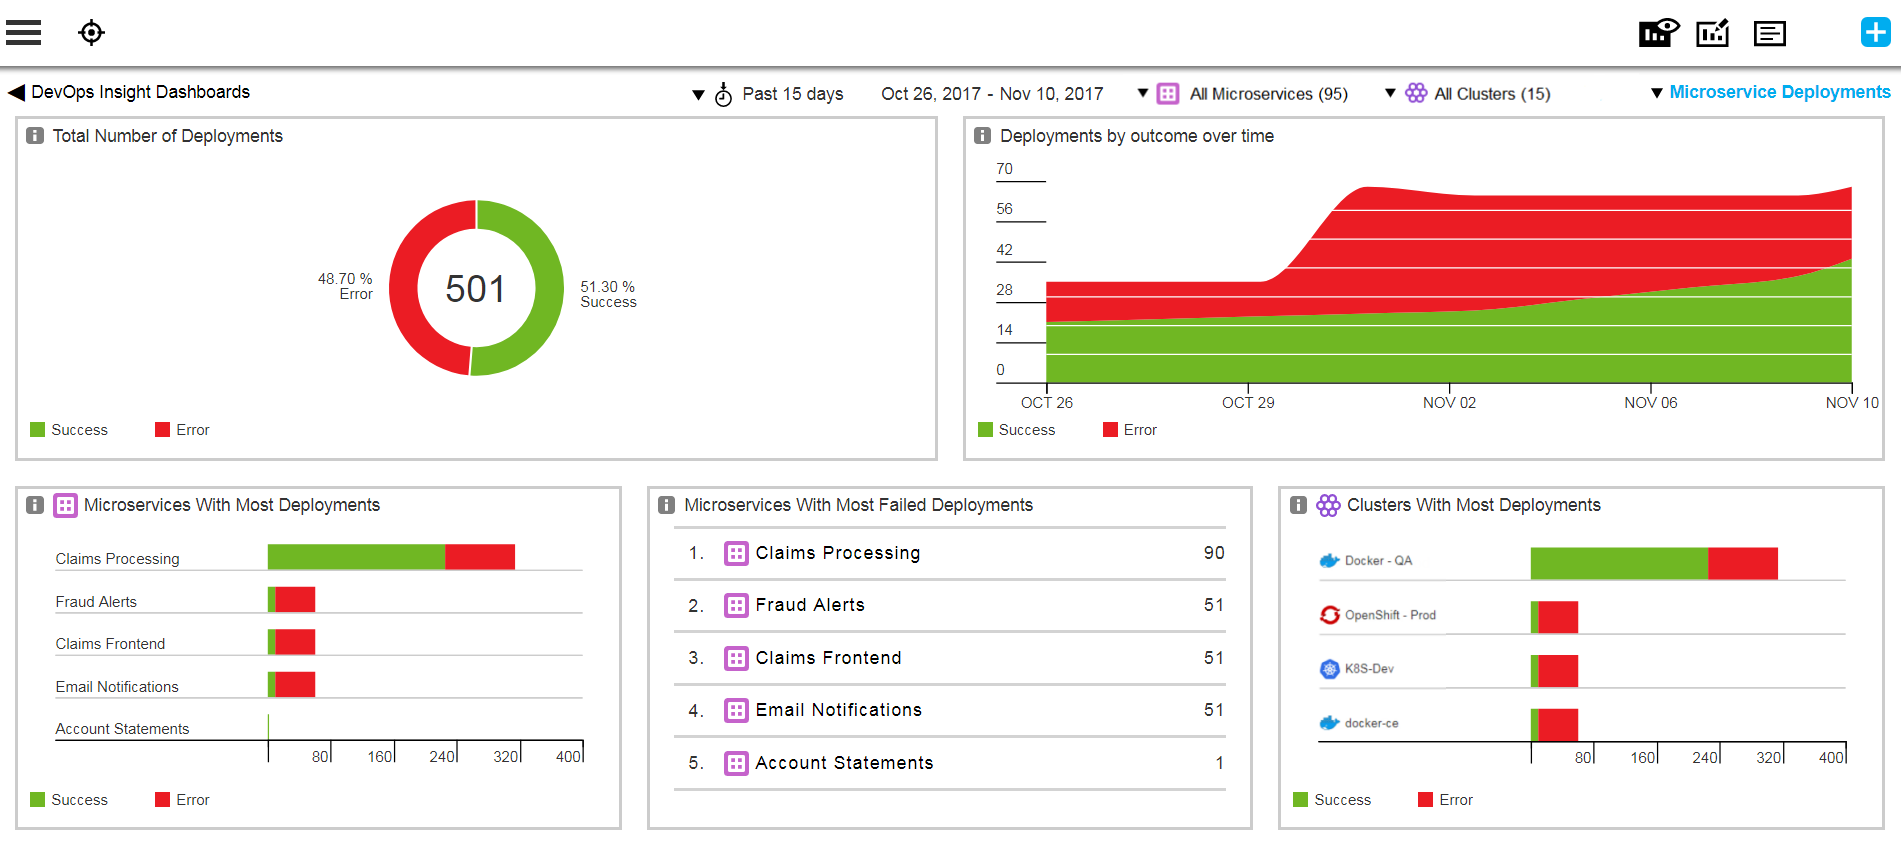
An overview of operations, usually on a specific subject. Can include logs, graphs and pie charts.
For our developers, we provide three main dashboards. This enables quick access to the information required in the 3 main states of software development.
| Dashboard | DevOps stage |
|---|---|
| View of build jobs status | Build and Test |
| View of deployment logs | Release and Deploy |
| View of running stats and logs | Operate and Monitor |
They include a mixture of Metrics and Logs.
What are metrics?
These are a numeric representation of something in the system. It could be render time of a page, response time to a request, build duration, number of 404s in a timeframe or percentage of cpu usage.
Some or all of these may be relevant for each of the stages above.
What are logs?
You application should be logging what it doing, mainly to spot when things go wrong and can provide a clue to the cause.
A basic log should be well structured, json for instance, this enables better analysis. Logs should include the timestamp, a message and other other relevant contextual information.
Putting them together
An ELK/Elastic stack or Loggly can help with logging to a central server.
Previous Post: Optimised Technologist delivery? Next Post: Where to start with cloud security? Tags: dashboard · dashboards · developer experience · devops · logs · metrics